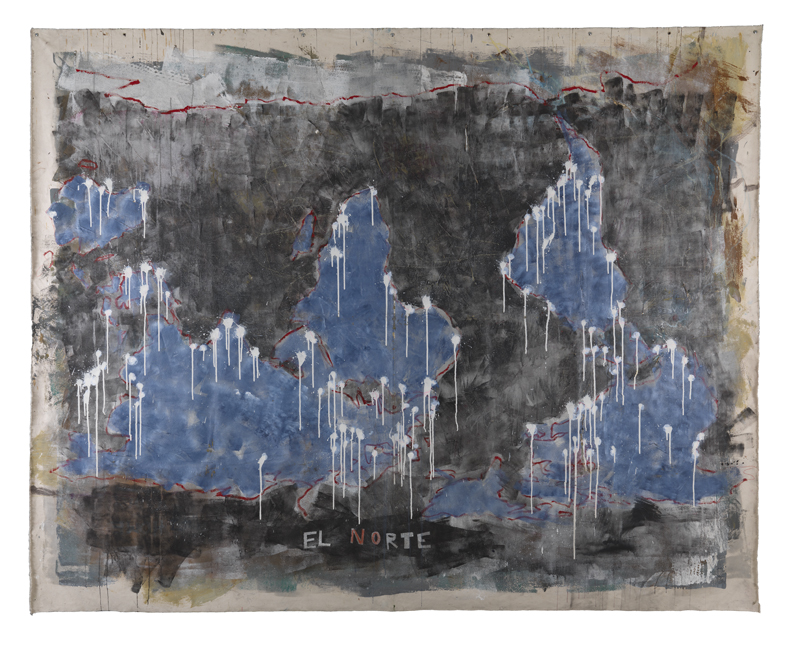
Global Optimization Diagram
Ana Vizcarra Rankin
Global Optimization Diagram takes a flattened Mercator projection map of the globe as a point of reference, depicts it as a vertically inverted version of this “traditional” view so the southern hemisphere is at the top and northern hemisphere is at the bottom. This tradition was set by Flemish geographer Gerardus Mercator in 1569, a cartographer responsible for our most common two-dimensional view of the world. The Mercator projection was well-suited for sea navigation but distorts objects further away from the equator by making them seem larger than they are, particularly in the cases of North America, Antarctica and Russia. Critics have suggested that this distortion of increased size and orientation of the Northern Hemisphere at the top of the map affects our collective senses of the relative importance of the nations, where those that appear higher and larger are held in esteem. By making this work in dialogue with artist Joaquin Torres Garcia’s work, Rankin enacts a politics of citation and pushes viewers to reconsider how direction and spatial distribution impact our sense of the world, reframing how we view geographic space.
Artist
Date of Birth
(b. 1977)
Date
2012
Medium
Gesso, acrylic and oil pastel on canvas
Dimensions
84 x 105 in. (213.36 x 266.7 cm.)
Accession #
2012.14
Credit Line
Judith McGregor Caldwell Purchase Prize from the Pennsylvania Academy Annual Student Exhibition
Copyright
© artist or artist’s estate
Category
Subject
More by
We're so excited you're planning to visit PAFA!
Make time for art — visit us Thursday to Sunday.
Before reserving your tickets, please review helpful information about museum hours, accessibility, building access, and special admission programs.
If you have any questions, feel free to reach out to us at visitorservices@pafa.org — we’d love to help!